Documentation
A complete guide to every feature in Outcomap — from navigating the canvas to publishing your finished map.
The editor layout
When you open a map in the editor, the screen is divided into three areas. On the left is the control panel, where you manage everything about your map — its look, structure, entities, and sharing settings. In the center is the map canvas, the live interactive visualization of your graph. On the right is the info pane, which shows search results and entity details when you click on something.
The left panel has six tabs along its top edge:
- –Styles — choose a theme and upload your logo
- –Layout — control spacing, node sizes, and hover behavior
- –Schema — manage the types of entities and relationships in your map
- –Entities — browse, search, edit, and bulk-manage your nodes and groups
- –Share — invite collaborators and manage access
- –Settings — rename, publish, or delete the map
Many actions in the Schema and Entities tabs open a secondary slide-out panel to the right of the first one. You can close it at any time with the × button.
The map canvas
The canvas is the heart of Outcomap — it renders your knowledge graph as a live, interactive visualization. Every node, edge, and group is drawn here, and you can navigate it freely.
Panning and zooming
Click and drag anywhere on the background to pan around the map. Use your mouse wheel (or trackpad pinch) to zoom in and out. You can also use the + / − zoom buttons in the top-left corner of the canvas. The zoom level indicator next to those buttons shows your current level from 1 (far out) to 6 (very close in).
Clicking nodes
Click any circular node to select it. The camera smoothly zooms in and centers on it, a colored pin appears at its location, and the info pane on the right slides open showing that entity's details. Edges connected to the node also light up based on your highlight settings.
Clicking group labels
Click on a group's label (the text above or inside a group boundary) to select the entire group. The camera zooms to fit the group in view, and the info pane shows the group's details. All nodes inside the group and their labels are highlighted at full brightness; everything outside dims.
Clicking edges
Edges become clickable when you are zoomed in to level 3 or closer. Click a line to see the relationship's details — its type, source, and target — in the info pane.
Clicking the background
Clicking empty space on the canvas clears any active selection, closes the info pane, and removes highlighting, returning the map to its neutral state.
Tip
If your map feels cluttered at the default zoom, try zooming all the way out (level 1 or 2) to get a bird's-eye view of the overall structure first, then zoom in to the areas you care about.
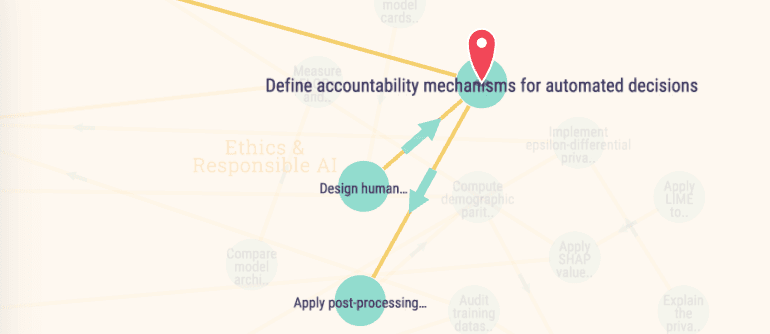
Hovering & highlighting
When you hover over a node or group, Outcomap highlights that entity and its immediate neighbors, dimming everything else. This lets you trace connections without clicking into each entity individually.
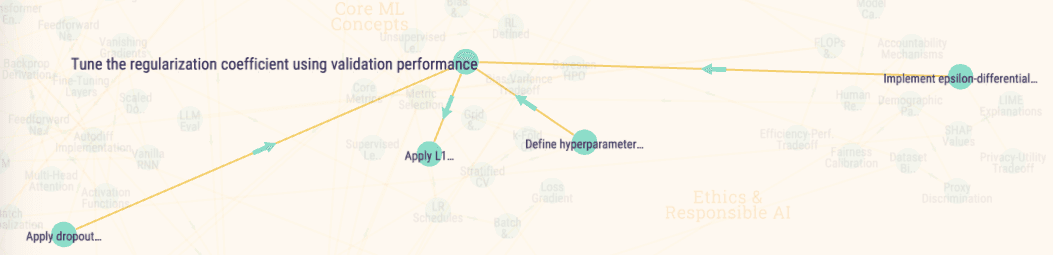
The exact behavior — how many hops out to highlight and which directions to follow — is controlled by your hover configuration in the Layout tab (see Hover behavior). Different blueprints have different defaults.
When a group is selected by clicking its label, its child group labels are also highlighted alongside the nodes inside it.
Search & filters
The info pane on the right side of the canvas has a search box at the top. Type any word and Outcomap searches across entity names, descriptions, and attributes, showing the top matches in a dropdown. Click a result to navigate directly to that entity on the map.
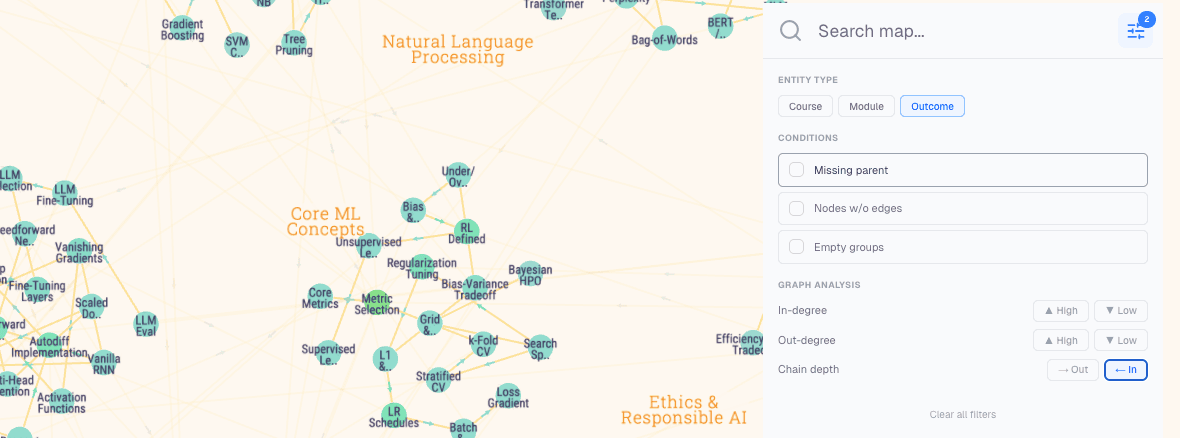
Filters
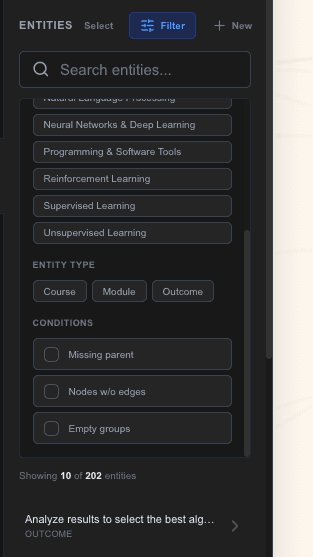
Click the filter icon (the sliders icon) next to the search box to open the filter panel. You can combine multiple filters at once:
- –Entity type — show only nodes of a specific type (e.g. only "Learning Outcome" or only "Assessment")
- –Missing parent — highlight entities that haven't been assigned to a group yet
- –Isolated — entities with no incoming or outgoing connections at all
- –No children — groups that contain no child nodes
- –High / Low incoming degree — entities that have many or few connections arriving at them
- –High / Low outgoing degree — entities that have many or few connections leaving them
The filter badge on the filter button shows how many filters are currently active. Click Clear all to reset.
Chain depth mode
The filter panel also has a chain depth mode. When you switch on Outgoing chain, Outcomap highlights the full downstream chain from any node you hover over — every node that can be reached by following edges forward. Incoming chain does the same in reverse, tracing back to every ancestor. This is particularly useful for spotting which learning outcomes ultimately feed into a given standard, or which prerequisites are required for a given course.
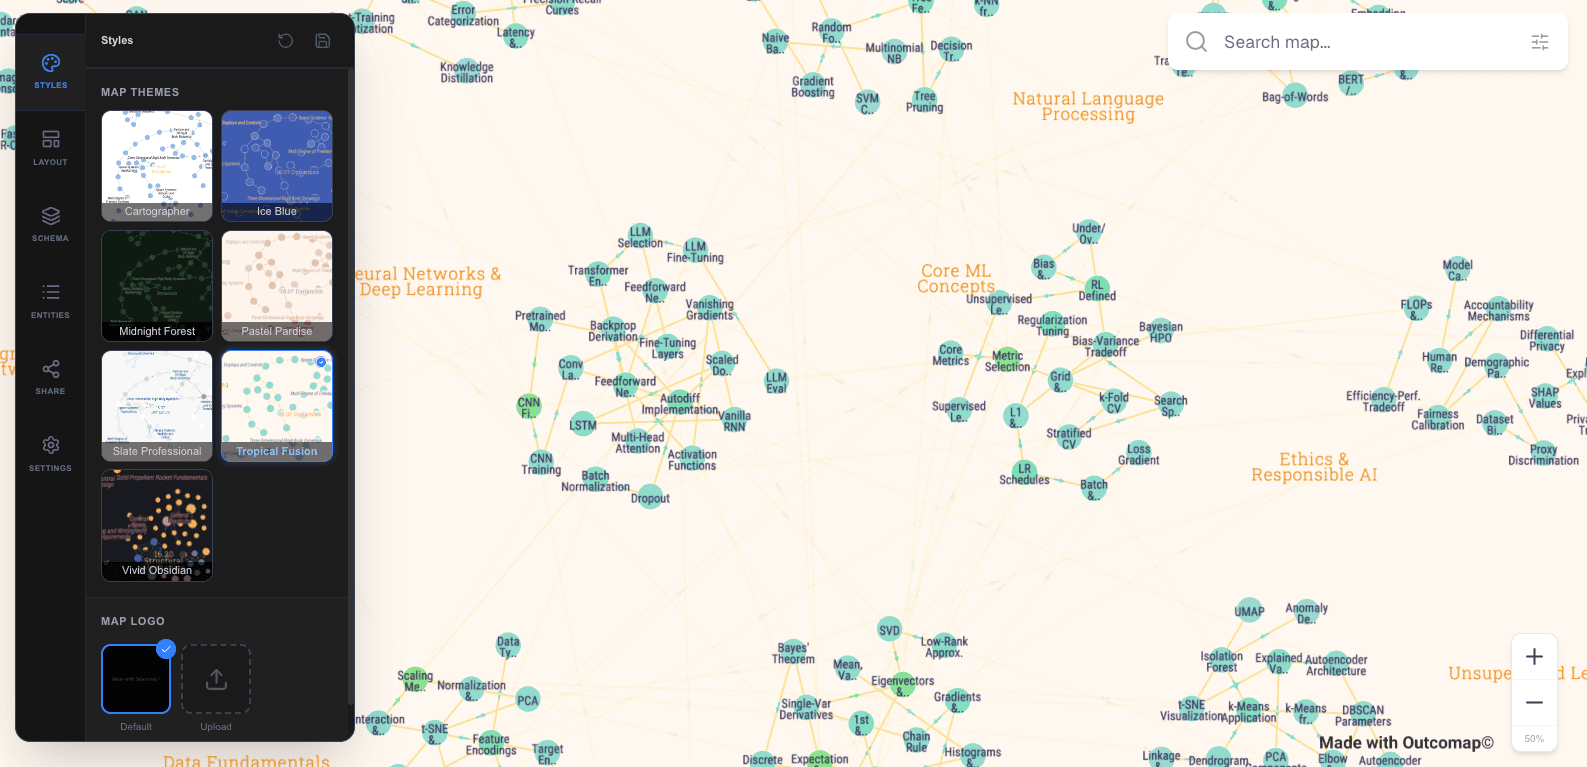
Themes
Themes control the visual style of your map — the background color, node colors, edge colors, and typography. Switch themes at any time without changing your data.
Open the Styles tab in the left panel. You'll see a grid of theme thumbnails. Click one to preview it live on your canvas. The theme is not saved yet at this point — you're just previewing. When you're happy with the choice, click Save. If you change your mind, click Revert to go back to the previously saved theme.
Note
Themes and blueprints work together. The blueprint defines the structure of visual rules (which properties drive node size, which edge types get arrows), while the theme fills in the colors and fonts. Switching themes doesn't change your blueprint.
Your logo Pro
Pro plan users can upload a custom logo that appears on the map canvas. This is useful when sharing or embedding the map in an institutional context.
In the Styles tab, scroll below the theme grid to find the logo section. Click Upload Custom Logo and choose an image file. Outcomap automatically selects between a light and dark version of your logo based on the map's background color. To remove your custom logo and return to the Outcomap default, click Use Default Logo.
Spacing & link distance
Open the Layout tab and expand the Layout section to control how densely your graph is laid out.
- –Group spacing — the distance between the outer boundaries of each group. Increase this to spread groups further apart; decrease it to pull them closer.
- –Link distance — the target distance between nodes that share a connection within the same group. Larger values make the graph airier inside each group; smaller values make nodes cluster tighter.
After adjusting, click Save and then trigger a layout recalculation (using the regenerate button in the Entities or Schema tab) to see the effect.
Tip
If your group labels are overlapping, increasing group spacing is usually the fastest fix.
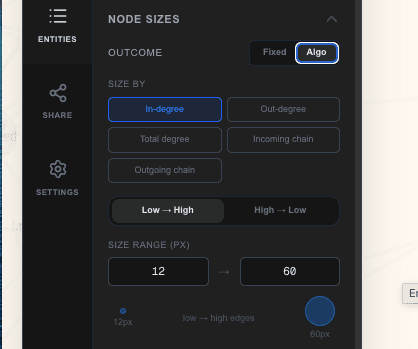
Node sizes
By default, node sizes are defined by your blueprint. The Layout tab lets you override the size rules for any entity type in your map.
Open the Layout tab and expand Node Sizes. Each entity type in your map is listed. For each type you can choose between two modes:
Fixed size
Every node of this type is drawn at the same radius, regardless of its connections. Enter the size in pixels.
Algorithmic size
Node size is calculated automatically based on a property you choose. Nodes with higher values get larger (or smaller, depending on direction). Available properties:
- –Incoming degree — how many edges point INTO this node
- –Outgoing degree — how many edges point OUT of this node
- –Total degree — total number of connections (in + out)
- –Incoming chain depth — how long the longest chain of predecessors leading to this node is
- –Outgoing chain depth — how long the longest chain of descendants this node leads to
Set the direction to Ascending (higher value = bigger node) or Descending (higher value = smaller node), and set the minimum and maximum radius to control the range.
Click Save after configuring each type. The blueprint defaults are shown next to each control as a reference.
Hover behavior
Open the Layout tab and expand Hover / Highlight to configure what happens when a user hovers over a node.
- –Depth — how many relationship hops to include in the highlight. A depth of 1 highlights only direct neighbors. A depth of 2 highlights neighbors-of-neighbors, and so on. Set it to a very high number to highlight the entire connected component.
- –Direction — which edges to follow. "Both" highlights everything connected in either direction. "Incoming only" shows what leads to this node. "Outgoing only" shows what this node leads to.
Click Save after adjusting. These settings apply map-wide; individual entity types can have their own defaults set in the blueprint.
Entity types
Every node and group in your map has a type — for example, "Course," "Learning Outcome," or "Standard." Entity types are how you tell Outcomap what your things are, so it can style them consistently and let you filter by category.
Open the Schema tab to see a tree of all entity types in your map. Each type shows a colored swatch, its name, and whether it is a node type or a group type. Click any type to open the type editor.
Creating a type
Click + Add Entity Type at the bottom of the list. Give it a name. Choose whether it represents individual nodes or groups (containers). Click Save.
Editing a type
Click the type row to open its editor. You can rename it, add or remove custom attributes that all entities of this type will carry, and see how many entities currently use it.
Note
Deleting an entity type is permanent and will affect all entities of that type. The editor will show you how many entities and relationships would be affected before you confirm.
Relationship types
Every edge in your map has a relationship type — for example, "requires," "assesses," or "related to." Relationship types define the vocabulary of your map.
In the Schema tab, scroll down to the Relationship Types section. Click any relationship type to edit it, or click + Add Relationship Type to create a new one.
When creating or editing a relationship type, you set two things:
- –Directed or Undirected — a directed relationship has a clear source and target (e.g. "A requires B" means A depends on B, not the other way around). An undirected relationship is mutual (e.g. "A is related to B").
- –Arrow direction — for directed relationships, whether the arrow points forward (from source to target), backward, or both ways.
Entity list
The Entities tab contains a searchable, filterable list of every entity in your map. Use it to find specific nodes, spot structural issues, and navigate to entities on the canvas.
Browsing and searching
Entities are listed by type. Use the search box to narrow by name. Click the filter icon to filter by entity type, or to find entities that are isolated (no connections), missing a parent group, or groups with no children.
Locating entities
Click any entity row to open its editor. From there, click Locate in map to have the canvas zoom directly to that entity.
Regenerating the layout
If you've added or removed entities and the map layout looks disorganized, click the Regenerate layout button (the circular arrow icon) in the Entities or Schema tab. This recalculates all node positions while respecting your spacing settings.
Editing an entity
Click any entity in the list — or click a node on the canvas — to open the entity editor. From here you can change everything about that entity.
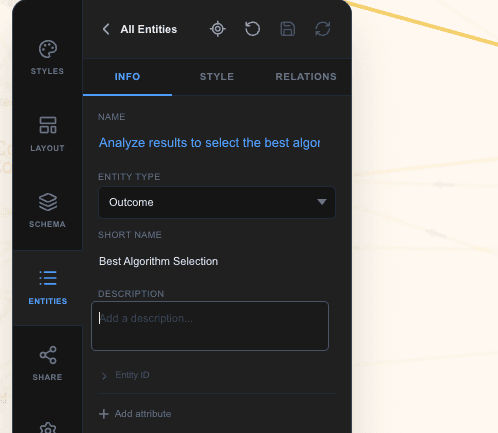
Core fields
- –Name — the label displayed on the map
- –Short name — an optional abbreviated label used in space-constrained views
- –Type — which entity type this node belongs to
- –Description — free text notes about this entity
- –Custom attributes — any extra fields defined for this entity type (e.g. "Credit hours," "ABET criterion")
Relationships
The relationships panel shows the entity's parent group, all outgoing edges (edges leaving this node), all incoming edges (arriving at this node), and — for groups — any children. You can add new edges, edit existing ones, or remove them from here.
Style overrides
By default, every entity is styled by your blueprint and theme. The style overrides section lets you set a custom color or size for a specific entity that overrides those defaults:
- –Fill color — set a specific color for this node (static hex color, or an algorithmic rule based on its properties)
- –Label color — override the color of this node's text label
- –Radius — set a specific size for this node (fixed pixels, or algorithmic)
Each override shows the currently computed default as a placeholder, so you can see what you're overriding. Click the × next to any override to clear it and return to the default.
Click Save entity when you're done. The map updates immediately.
Bulk actions
You can perform actions on multiple entities at once using the multi-select mode in the Entities tab.
Click the checkbox icon near the top of the entity list to enter select mode. Then check individual entities, or select all visible results. Once you have a selection, a menu of actions appears:
Change fill color
Apply a color to all selected entities at once. Choose a static hex color from the picker, or set an algorithmic rule that sizes color by a property such as incoming degree. Changes are previewed immediately on the canvas as pending — they aren't saved until you click the glowing Save changes button that appears at the top of the Entities tab.
Change node size
Set a fixed radius or an algorithmic size rule across all selected entities at once. Same pending/save flow as fill color.
Assign parent
Move all selected entities into a new parent group. Choose the group from a dropdown and click Apply.
Delete
Permanently removes all selected entities and any edges that were only connected to them. A confirmation step shows you exactly how many items will be deleted.
Building with AI Credits
Outcomap's AI can read your existing documents — syllabi, accreditation frameworks, course descriptions, or any structured text — and automatically extract nodes, groups, and relationships to build or extend your map.
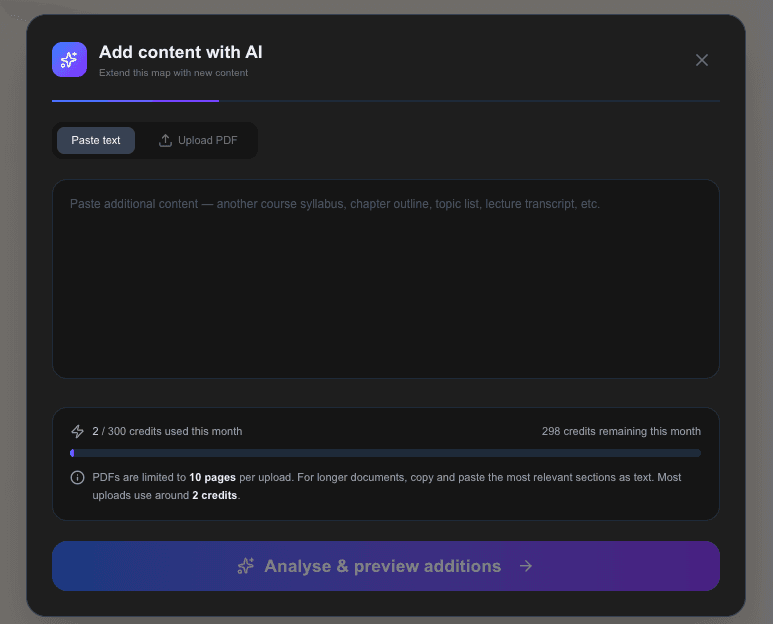
Adding content with AI
In the Entities tab, click Add content with AI. A full-screen modal opens. You can either paste text directly into the text box, or switch to the PDF tab and upload a PDF (up to 5 MB and 10 pages). Click Generate.
Outcomap will process your content and show you a preview of everything it intends to add — new entity types, new entities, new relationships — broken down by category. Review the preview, and if it looks right, click Confirm & Add. If you want to adjust what you provided, click Refine Input to go back.
Editing your map with AI
Once your map has content, click Edit map with AI. You give the AI a plain-language instruction describing the change you want, for example:
- –"Rename all Concept types to Learning Outcome"
- –"Add prerequisite links between the leaf nodes in each module"
- –"Delete all entities of type Draft and promote their children up one level"
The AI generates a set of changes and shows them to you as a diff — additions in green, deletions in red, modifications highlighted. Review it, then click Apply Changes or go back to refine your instruction.
AI history
The Schema tab keeps a log of every AI import you've run, showing the source (pasted text or PDF name), the date, and a breakdown of how many nodes, groups, edges, and types were added. This is useful if you want to understand how your map grew over time.
Note
AI generation consumes credits from your plan allowance. Your remaining credits are shown during generation. If you run out, you can upgrade your plan from your account settings.
Sharing & collaboration
Outcomap lets you invite other people to view or edit your map. Open the Share tab in the left panel.
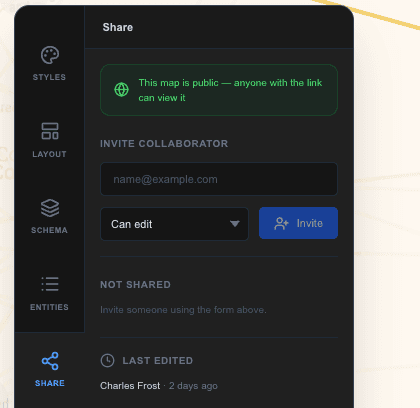
Inviting collaborators
Enter a collaborator's email address and choose their role:
- –Editor — can make changes to the map (add entities, edit content, change styling)
- –Viewer — can view and navigate the map but cannot make changes
Click Share. They'll receive access to the map and it will appear in their dashboard.
Managing access
The Share tab shows a list of everyone who has access. You can change any collaborator's role using the dropdown next to their name, or remove their access entirely with the × button.
Leaving a map
If you were invited to a map by someone else and no longer need access, you can click Leave this map in the Share tab. You'll be asked to confirm before being removed.
Publishing your map Pro
Publishing makes your map accessible to anyone with the link — no login required. This is useful for sharing a read-only interactive view with stakeholders, accreditation reviewers, students, or the public.
Open the Settings tab and click Publish. Once published, a public link appears that you can copy and share. Anyone who visits that link can pan, zoom, click nodes, and use search and filters — but cannot edit the map.
To take the map back to draft (private), click Unpublish. The public link will stop working immediately.
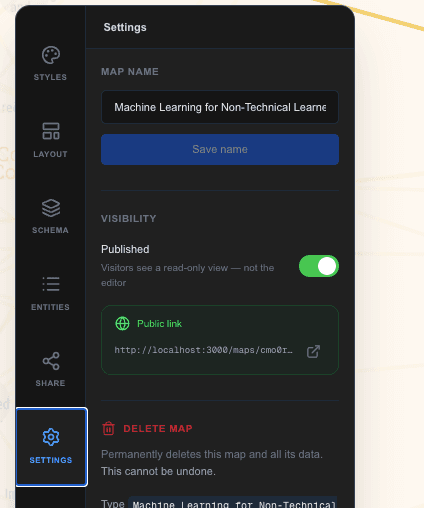
Embedding your map
Published maps can also be embedded as a live interactive widget inside any website, LMS, or presentation tool that supports iframes. Copy the embed code from the Settings tab and paste it into your platform's HTML editor.
Note
Publishing is a Pro plan feature. Free plan maps can only be shared with named collaborators via the Share tab.
Map settings
The Settings tab handles administrative options for your map.
Renaming the map
Click into the map name field, edit the text, and click Save. The new name appears in your dashboard and in the browser tab.
Deleting the map
Click Delete Map. A confirmation dialog will ask you to type the map's name to confirm. This action is permanent — the map and all its entities, relationships, and history are deleted immediately.
Something missing or unclear?
support@outcomap.com